The Western Digital WD Black SN750 SSD Review: Why Fix What Isn't Broken?
by Billy Tallis on January 18, 2019 8:01 AM ESTSequential Read Performance
Our first test of sequential read performance uses short bursts of 128MB, issued as 128kB operations with no queuing. The test averages performance across eight bursts for a total of 1GB of data transferred from a drive containing 16GB of data. Between each burst the drive is given enough idle time to keep the overall duty cycle at 20%.
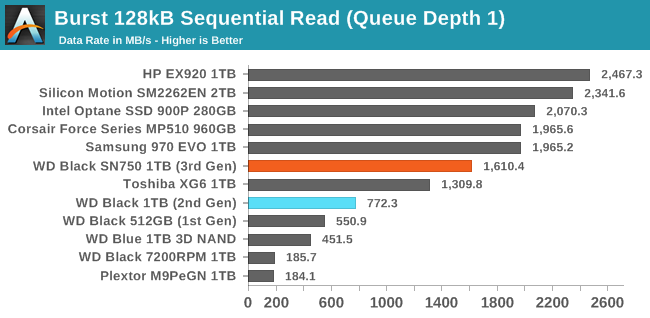
The queue depth 1 burst sequential read performance of the WD Black SN750 is faster than its predecessor, but there's still a lot of room for improvement relative to the fastest TLC SSDs and even the Corsair MP510 that relies on the same BiCS3 NAND as the SN750.
Our test of sustained sequential reads uses queue depths from 1 to 32, with the performance and power scores computed as the average of QD1, QD2 and QD4. Each queue depth is tested for up to one minute or 32GB transferred, from a drive containing 64GB of data. This test is run twice: once with the drive prepared by sequentially writing the test data, and again after the random write test has mixed things up, causing fragmentation inside the SSD that isn't visible to the OS. These two scores represent the two extremes of how the drive would perform under real-world usage, where wear leveling and modifications to some existing data will create some internal fragmentation that degrades performance, but usually not to the extent shown here.
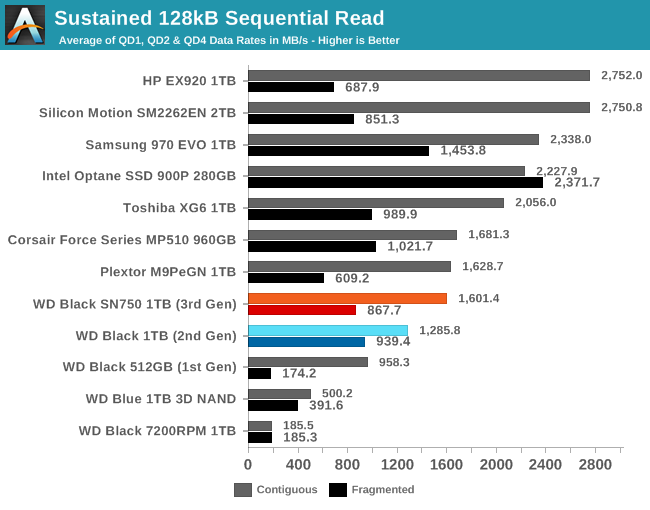
The performance of the WD Black SN750 on the longer sequential read test is a bit better than the previous model and more in line with other drives that use the same NAND, but still much slower than the top NVMe drives on this test. The performance when reading data that was not written to the drive sequentially has regressed slightly but is still decent for this class of drive.
 |
|||||||||
| Power Efficiency in MB/s/W | Average Power in W | ||||||||
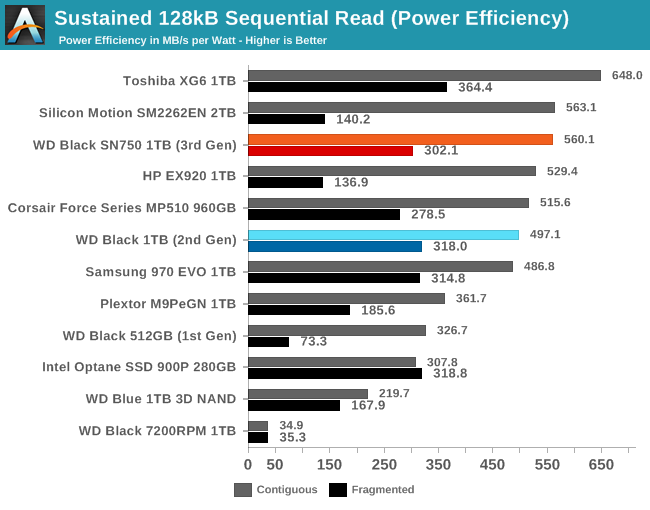
Despite relatively low performance, the SN750 still manages to be tied for second place in the power efficiency ranking, scoring about 13% lower than the Toshiba XG6.
 |
|||||||||
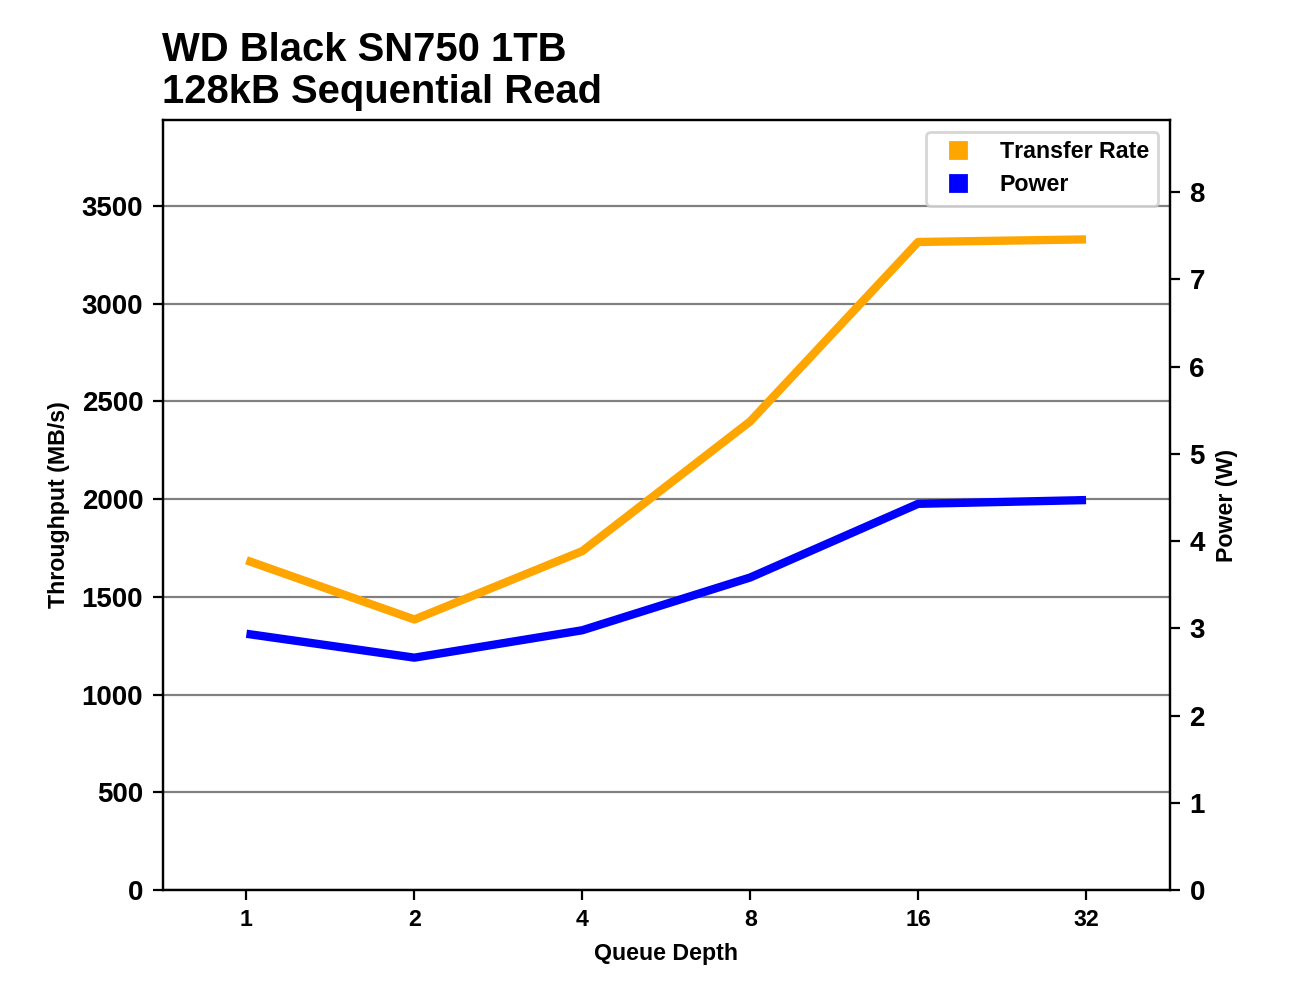
The WD Black SN750 suffers during the early stages of the sequential read test and doesn't hit its full read speed until the queue depth reaches about 16. The performance profile is very similar to last year's model save for a significant improvement at QD1. Several other drives also require fairly high queue depths to reach full speed, but most of the relevant competition has better low-QD performance than the WD Black.
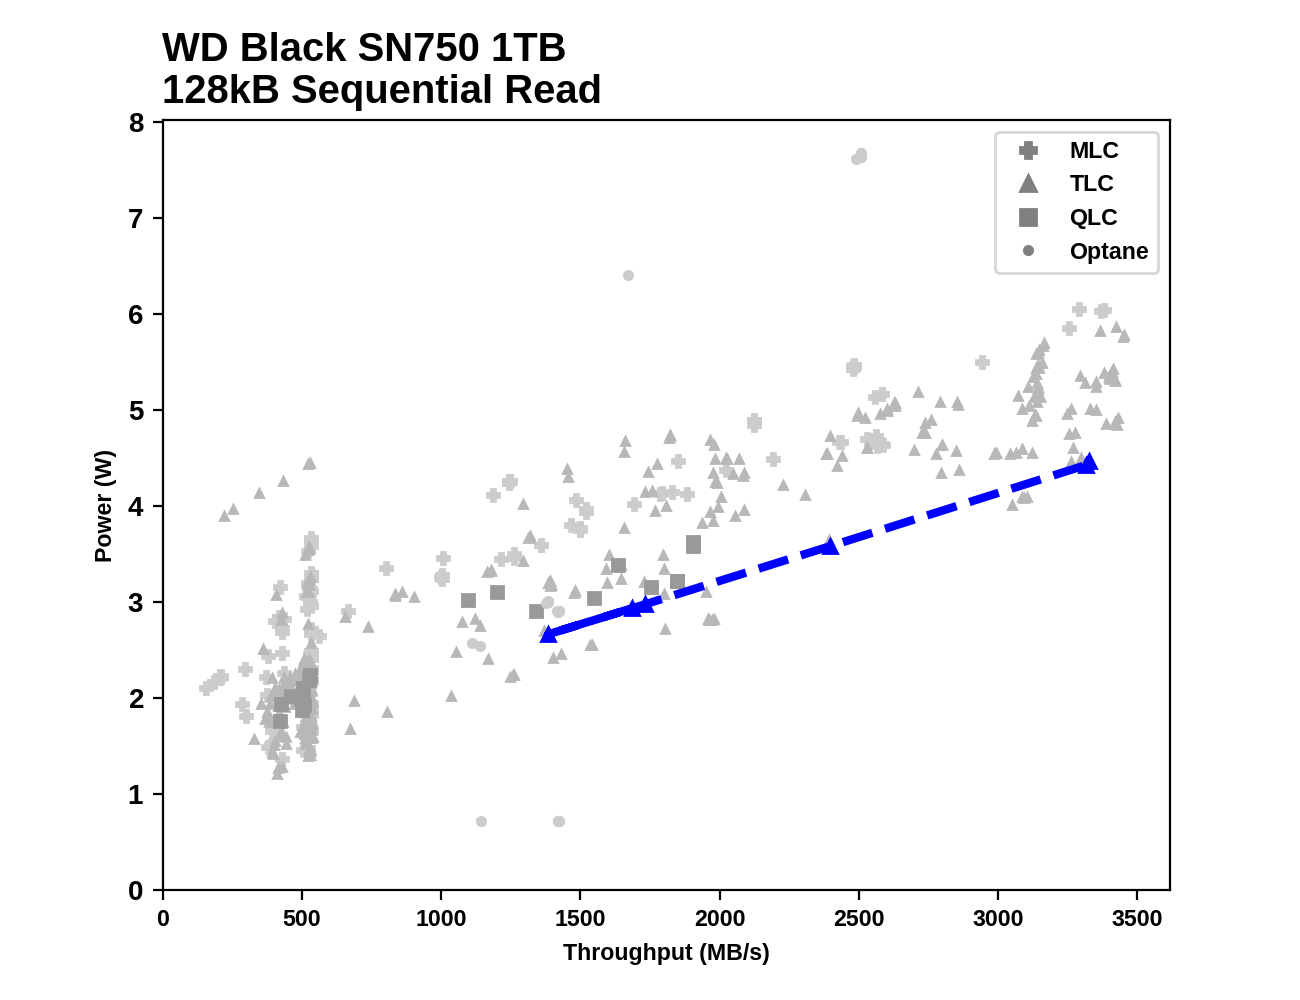
Even though the WD Black starts off slow, it still is fairly power efficient throughout the sequential read test and there are only few drives that offer better performance per Watt at any speed.
Sequential Write Performance
Our test of sequential write burst performance is structured identically to the sequential read burst performance test save for the direction of the data transfer. Each burst writes 128MB as 128kB operations issued at QD1, for a total of 1GB of data written to a drive containing 16GB of data.
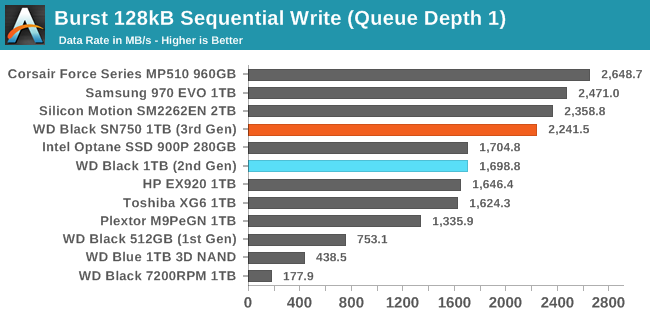
As with sequential reads, the QD1 burst sequential write performance of the WD Black SN750 is significantly improved over the previous model, and this time it gets relatively close to the top tier of drives.
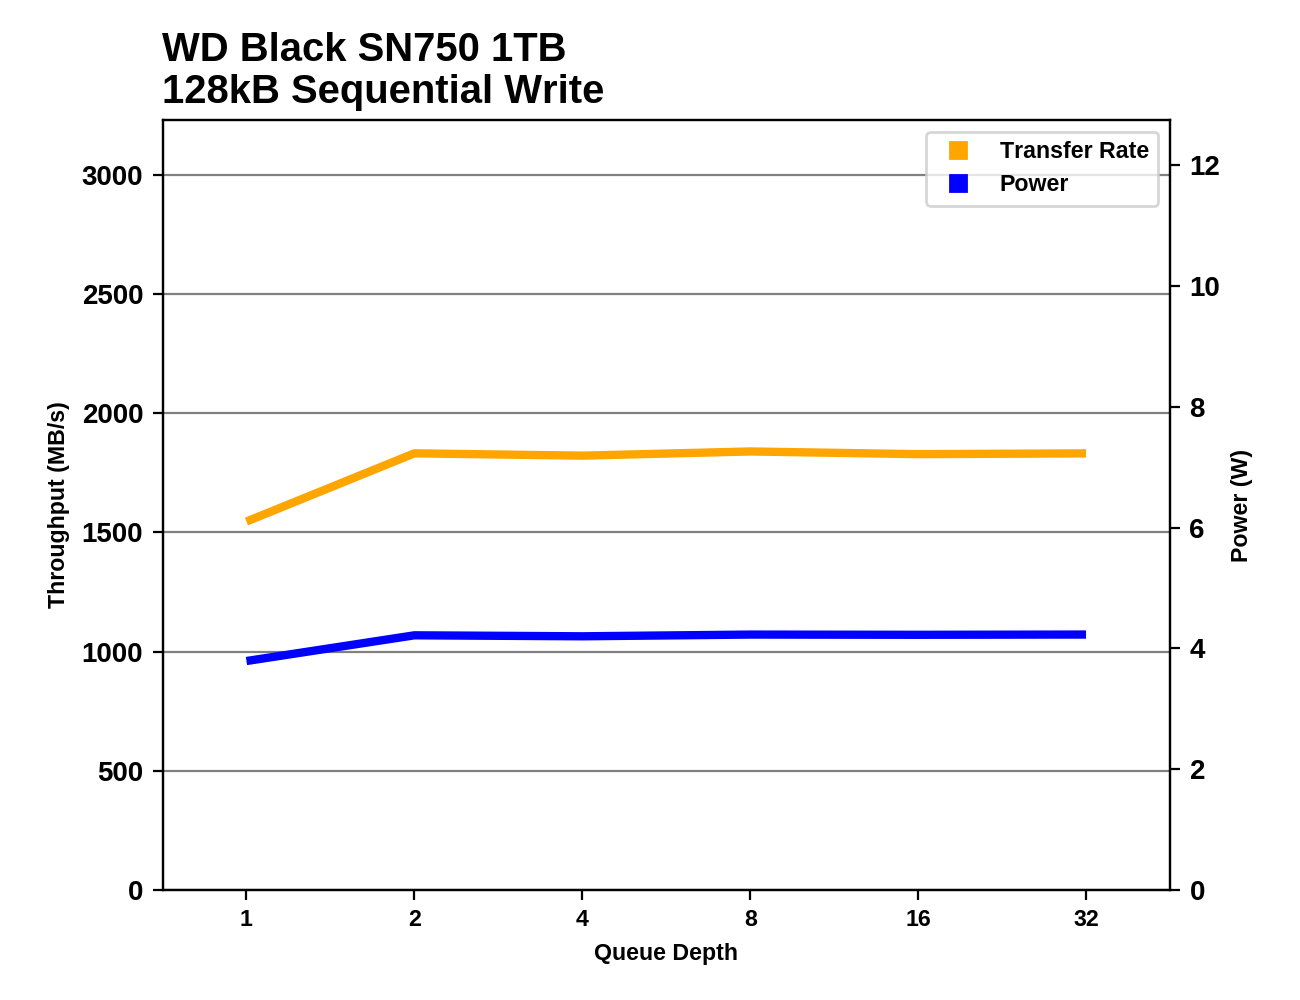
Our test of sustained sequential writes is structured identically to our sustained sequential read test, save for the direction of the data transfers. Queue depths range from 1 to 32 and each queue depth is tested for up to one minute or 32GB, followed by up to one minute of idle time for the drive to cool off and perform garbage collection. The test is confined to a 64GB span of the drive.
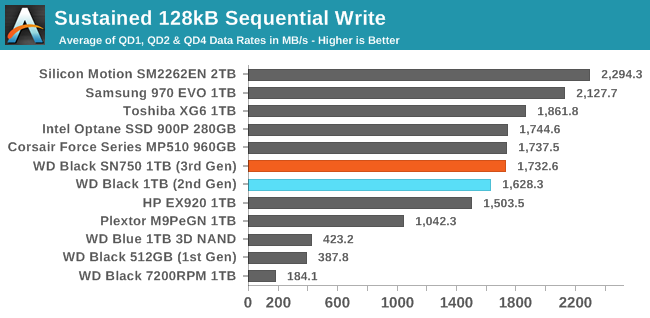
The SN750 also improves slightly on the longer sequential write test that adds in some higher queue depths, bringing it up to the level of the Corsair MP510 but still a bit behind the Toshiba XG6 and well behind the fastest TLC-based competition.
 |
|||||||||
| Power Efficiency in MB/s/W | Average Power in W | ||||||||
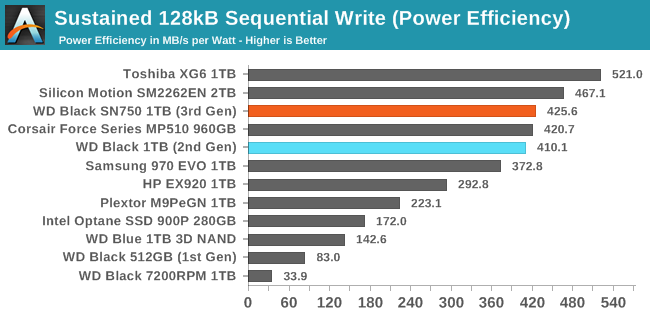
The SN750 can't claim another efficiency win due to its performance that is merely average for this product segment, but the efficiency score is still pretty good.
 |
|||||||||
The SN750's sequential write performance increases slightly from QD1 to QD2 and remains steady for the rest of the test. The top-performing SM2262EN sample doesn't hit full speed until QD4, at which point it is faster than the SN750 by almost 1GB/s.
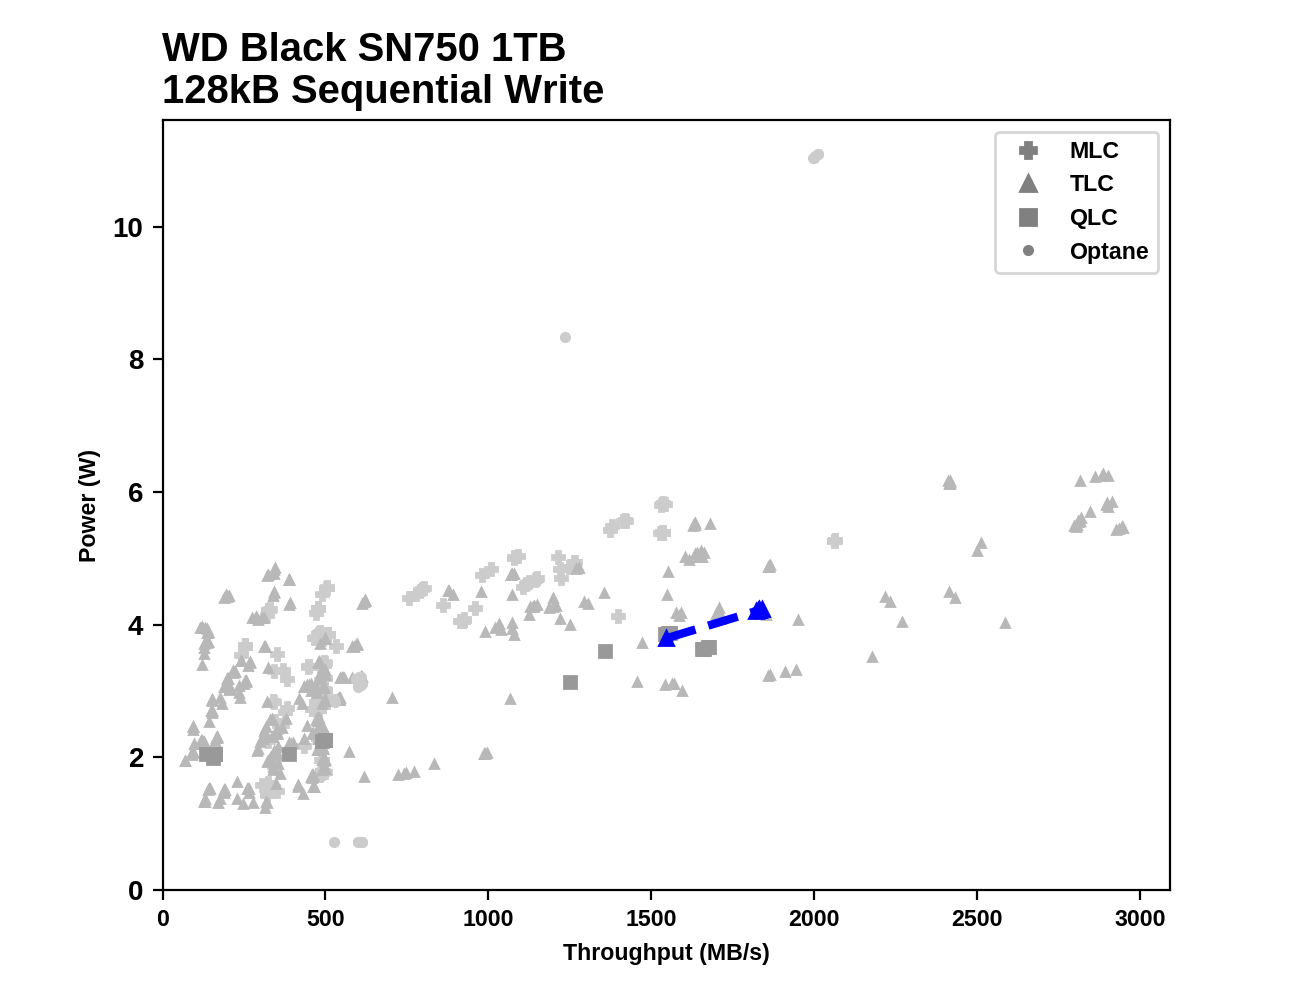
Among all the drives that have run through this test, the performance and power consumption of the SN750 both appear fairly middle of the road by NVMe standards; there are some drives that save almost 1W at the same speed, and a few that are far faster at similar power levels.


54 Comments
View All Comments
nevcairiel - Friday, January 18, 2019 - link
Whatever happend to the Samsung PRO in those comparisons? If you call something a "top NVMe SSD" and then don't have the PROs in there to stack up against, it feels incomplete.jordanclock - Friday, January 18, 2019 - link
Where do you see that they call it the top NVMe SSD?Comparing it to the 970PRO doesn't make a lot of sense since they are in vastly different price ranges and market segment. The 970 EVO is perfect because they are very close in price and market segment. They even admit in the conclusion that the "970 EVO may be the slightly better performer overall."
Drakkhen - Friday, January 18, 2019 - link
He didn't call it the top NVMe SSD, he said a "top NVMe SSD".But, I agree that it isn't really relevant since this comparison is for a different price point/market.
DanNeely - Friday, January 18, 2019 - link
I would like to see at at least on higher end drive that's not an Optane for comparison though.romrunning - Friday, January 18, 2019 - link
Agreedphilehidiot - Saturday, January 19, 2019 - link
I think it's always useful, regardless of where you are in the meerkat, to compare to the top and the bottom of the range. This gives you an idea of what you're getting. Am I getting 70% of top end performance for 70% of the price or am I getting 95% of it for 70% of the price? Those are two very different value propositions and certainly things we see often in the PC meerkat. Sometimes the progression with price is linear(ish) and sometimes you can spend double the cash to get the very best but really all you're seeing is a few percent extra performance because it takes that much extra R&D / materials investment to get there.29a - Friday, January 18, 2019 - link
In the second paragraph on the last page."the new WD Black is still a very competitive high-end NVMe SSD"
They do make the claim that it is a high end SSE which I would equate to being "a top NVMe SSD" and should be compared to the Samsung Pro models.
althaz - Friday, January 18, 2019 - link
Depends where you are I guess. The 500Gb WD Black is exactly the same price as the 512Gb Samsung 970 Pro where I live. Samsung's 970 EVO drives are $100/TB cheaper.Samus - Monday, January 21, 2019 - link
LOL, the 500GB WD Black is consistently close to half the price of the 980 Pro, and the 970 Pro is essentially the same performance as the EVO (hence them being similarly priced.)I agree, the 980 Pro should be in the benchmarks, but certainly not the 970 Pro. Just use the EVO as a baseline and add 3% if you want to be picky about exact figures.
Samus - Monday, January 21, 2019 - link
I forgot to add, or rather point out, the 970 EVO and 970 PRO share the same controller and are otherwise identical configurations with the exception of the PRO being MLC.That said, Samsung actually rates them near-identically in performance and aside from the SLC caching algorithm, the EVO performs the same.
The only real reason to get the PRO is if you need the DWPD\endurance of MLC. That's literally the only advantage the PRO has.