Sabrent Rocket Nano Rugged IP67 Portable SSD Review: NVMe in a M.2 2242 Enclosure
by Ganesh T S on October 30, 2020 8:00 AM EST
Portable bus-powered SSDs are a growing segment of the direct-attached storage market. The ongoing glut in flash memory (and the growing confidence of flash vendors in QLC) has brought down the price of these drives. Sabrent, a computer peripherals and accessories manufacturer, has made a name for itself in the space by catering to niche segments such as ultra-high capacity and compact SSDs. The company sent over a bunch of unique external SSDs to put through our strenuous review process. Today's review takes a look at the 2TB version of the Rocket Nano Rugged.
Introduction
External bus-powered storage devices have grown both in storage capacity as well as speeds over the last decade. Thanks to rapid advancements in flash technology (including the advent of 3D NAND and NVMe) as well as faster host interfaces (such as Thunderbolt 3 and USB 3.x), we now have palm-sized flash-based storage devices capable of delivering 2GBps+ speeds. Broadly speaking, there are five distinct performance levels in this market:
- 2GBps+ drives with Thunderbolt 3, using NVMe SSDs
- 2GBps drives with USB 3.2 Gen 2x2, using NVMe SSDs
- 1GBps drives with USB 3.2 Gen 2, using NVMe SSDs
- 500MBps drives with USB 3.2 Gen 1 (or, Gen 2, in some cases), using SATA SSDs
- Sub-400MBps drives with USB 3.2 Gen 1, using a flash controller with a direct USB interface
The Sabrent Rocket Nano Rugged we are looking at today belongs to the third category in the above list. It is a compact external SSD sporting a M.2 2242 NVMe SSD inside. The casing is all-metal, and the drive is IP67 rated for protection against dust ingress and water immersion. Thanks to its rubber bumper, it is also resilient to accidental drops.
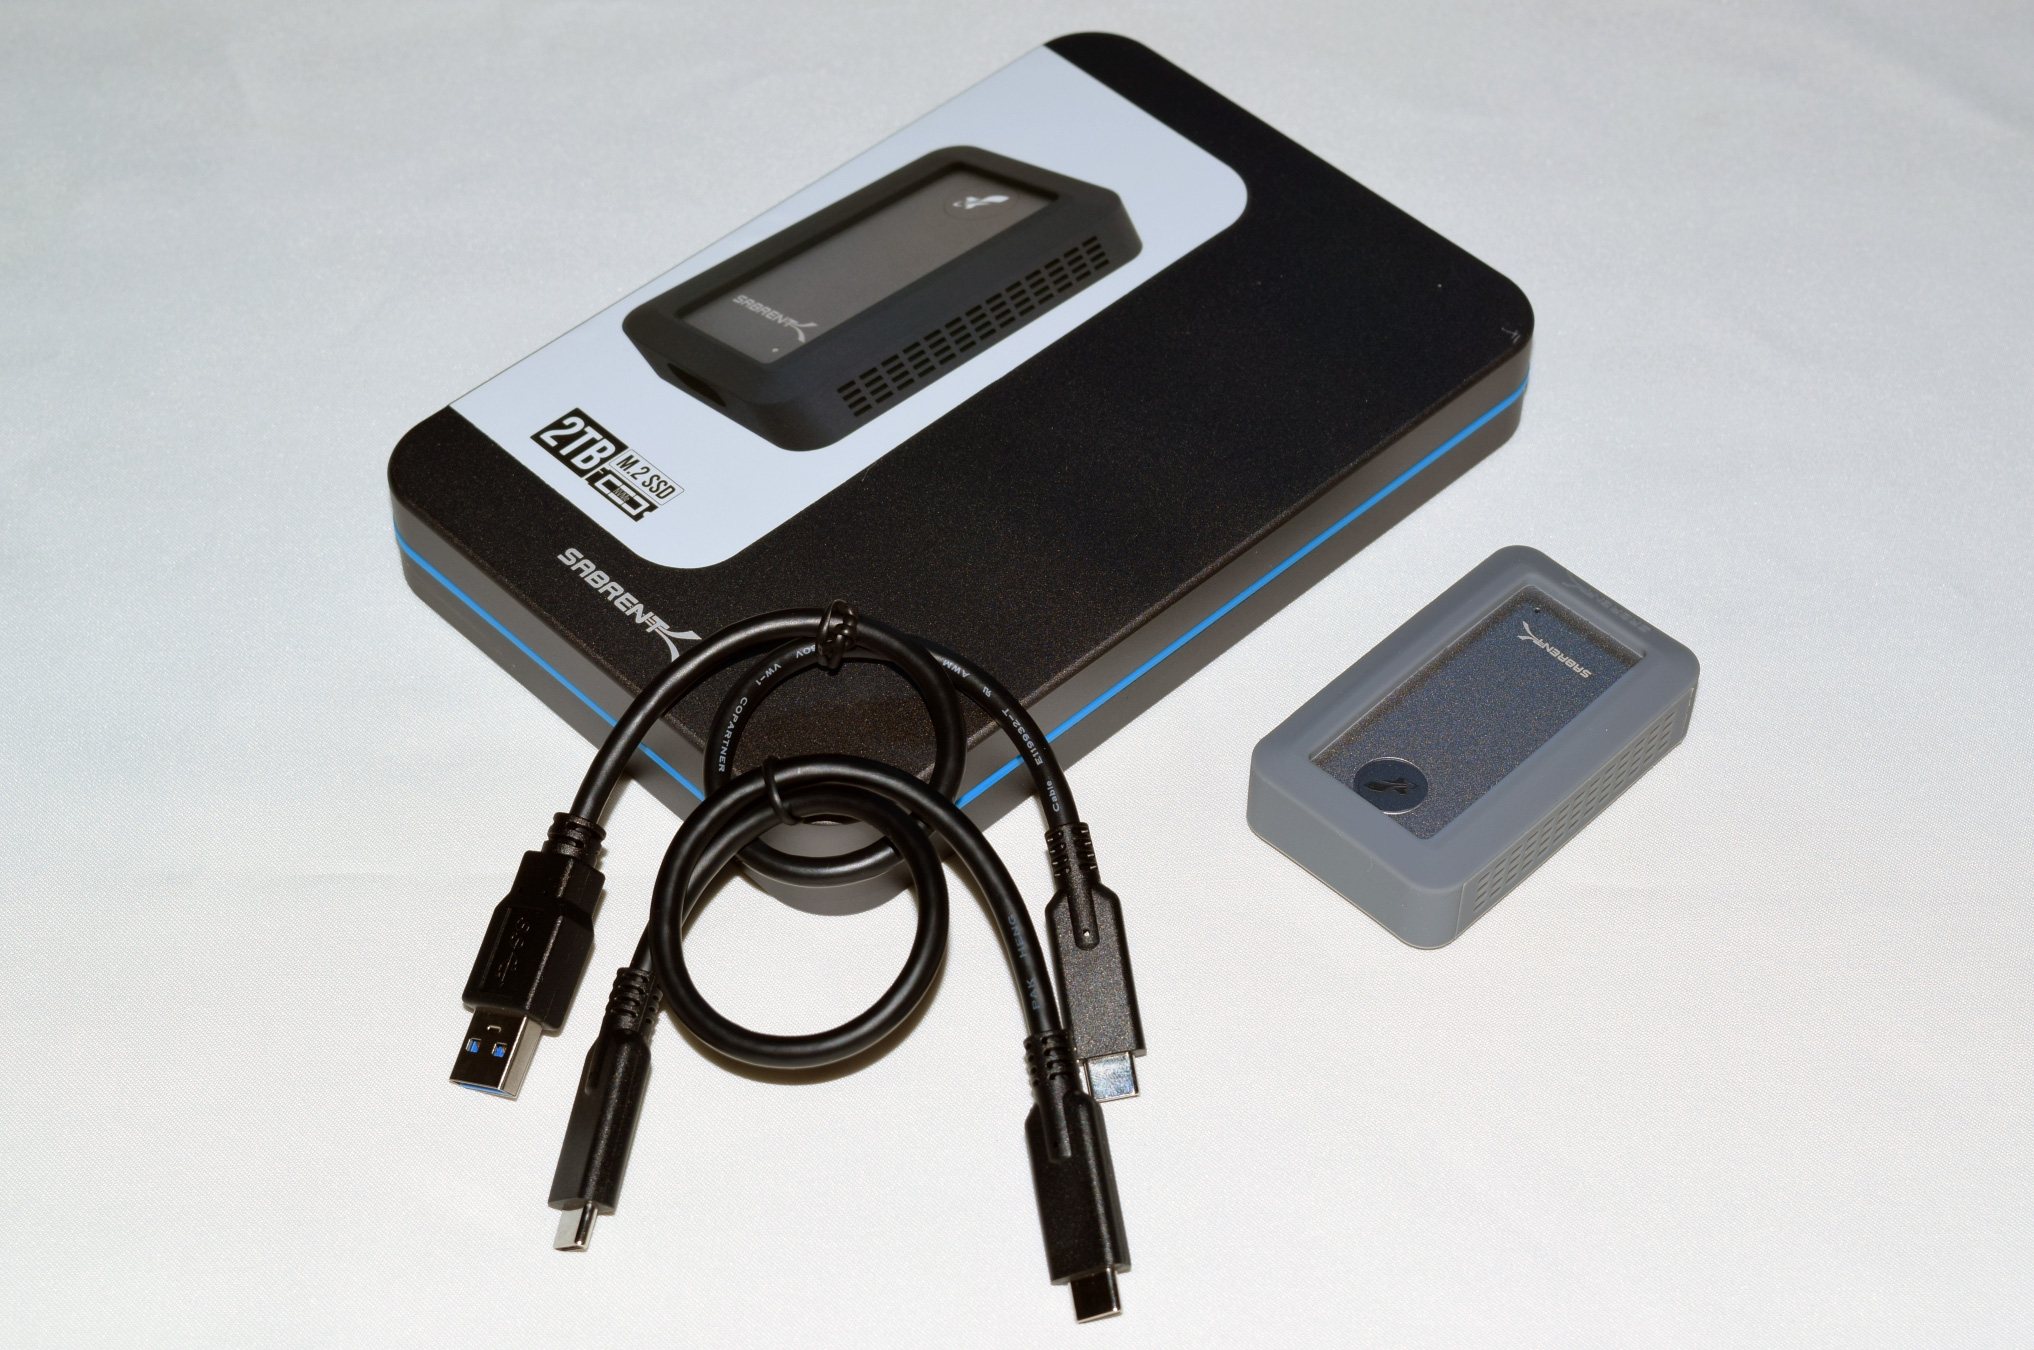
Sabrent packages the Rocket Nano Rugged in a metal case. It comes with a Type-C to Type-A, and a Type-C to Type-C cable. The gallery below shows additional photographs of the packaging and the drive itself.


The review compares the Rocket Nano Rugged 2TB against the other 2TB drives reviewed earlier.
- Sabrent Rocket Nano Rugged 2TB
- Crucial Portable SSD X8 2TB
- OWC Envoy Pro EX USB-C 2TB
- SanDisk Extreme PRO Portable SSD v2 2TB [JHL6540]
A quick overview of the internal capabilities of the storage devices is given by CrystalDiskInfo.
| Drive Information |
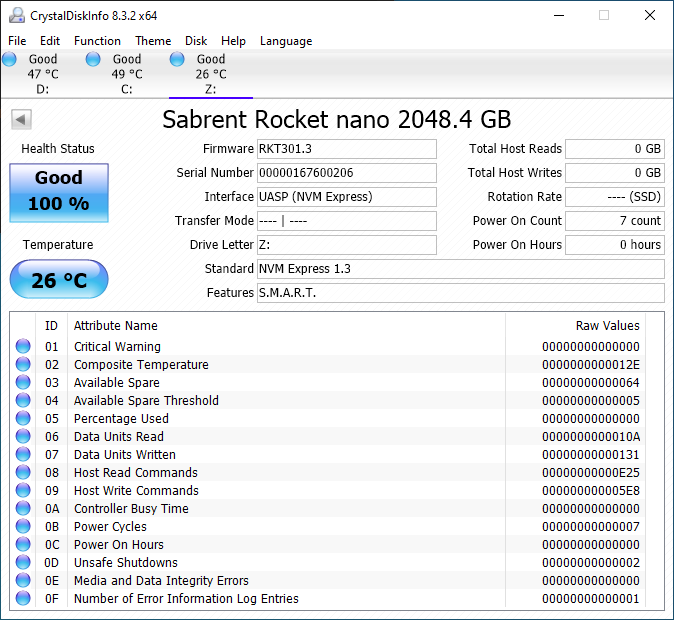 |
Sabrent has a customized firmware for the Phison controller, and its behavior is also different from the standard external SSD release (as we shall see further down). TRIM is not amongst the reported features, but it is supported.
Testbed Setup and Testing Methodology
Evaluation of DAS units on Windows is done with a Hades Canyon NUC configured as outlined below. We use one of the rear USB Type-C ports enabled by the Alpine Ridge controller for both Thunderbolt 3 and USB devices.
| AnandTech DAS Testbed Configuration | |
| Motherboard | Intel NUC8i7HVB |
| CPU | Intel Core i7-8809G Kaby Lake, 4C/8T, 3.1GHz (up to 4.2GHz), 14nm+, 8MB L2 |
| Memory | Crucial Technology Ballistix DDR4-2400 SODIMM 2 x 16GB @ 16-16-16-39 |
| OS Drive | Intel Optane SSD 800p SSDPEK1W120GA (118 GB; M.2 Type 2280 PCIe 3.0 x2 NVMe; Optane) |
| SATA Devices | Intel SSD 545s SSDSCKKW512G8 (512 GB; M.2 Type 2280 SATA III; Intel 64L 3D TLC) |
| Chassis | Hades Canyon NUC |
| PSU | Lite-On 230W External Power Brick |
| OS | Windows 10 Enterprise x64 (v1909) |
| Thanks to Intel for the build components | |
Our evaluation methodology for direct-attached storage devices adopts a judicious mix of synthetic and real-world workloads. While most DAS units targeting a particular market segment advertise similar performance numbers and also meet them for common workloads, the real differentiation is brought out on the technical side by the performance consistency metric and the effectiveness of the thermal solution. Industrial design and value-added features may also be important for certain users. The remaining sections in this review tackle all of these aspects after analyzing the features of the drives in detail.
Device Features and Characteristics
Prior to looking at the usage characteristics of the Rocket Nano Rugged, it is helpful to compare its specifications against other drives, and also take a look at its internals.
| Direct-Attached Storage Characteristics | ||
| Aspect | ||
| Upstream Port | USB 3.2 Gen 2 Type-C | USB 3.2 Gen 2 Type-C |
| Bridge / Controller | JMicron JMS583 + Sabrent-branded Phison E13T | ASMedia ASM2362 + Silicon Motion SM2263 |
| Flash | Kioxia (Toshiba) BiCS 4 96L 3D TLC | Micron 96L 3D QLC |
| Power | Bus Powered | Bus Powered |
| Physical Dimensions | 37.85 mm x 66 mm x 12.7 mm | 110 mm x 53 mm x 11.5 mm |
| IP Rating | IP67 | N/A |
| Weight | 78 grams (without cable and bumper) 92 grams (with bumper, without cable) |
101 grams (without cable) |
| Cable | ~30 cm USB 3.2 Gen 2 Type-C to Type-A ~30 cm USB 3.2 Gen 2 Type-C to Type-C |
23 cm USB 3.2 Gen 1 Type-C to Type-C Type-C to Type-A adaptor bundled |
| S.M.A.R.T Passthrough | Yes | Yes |
| UASP Support | Yes | Yes |
| TRIM Passthrough | Yes | Yes |
| Encryption Support | N/A | N/A |
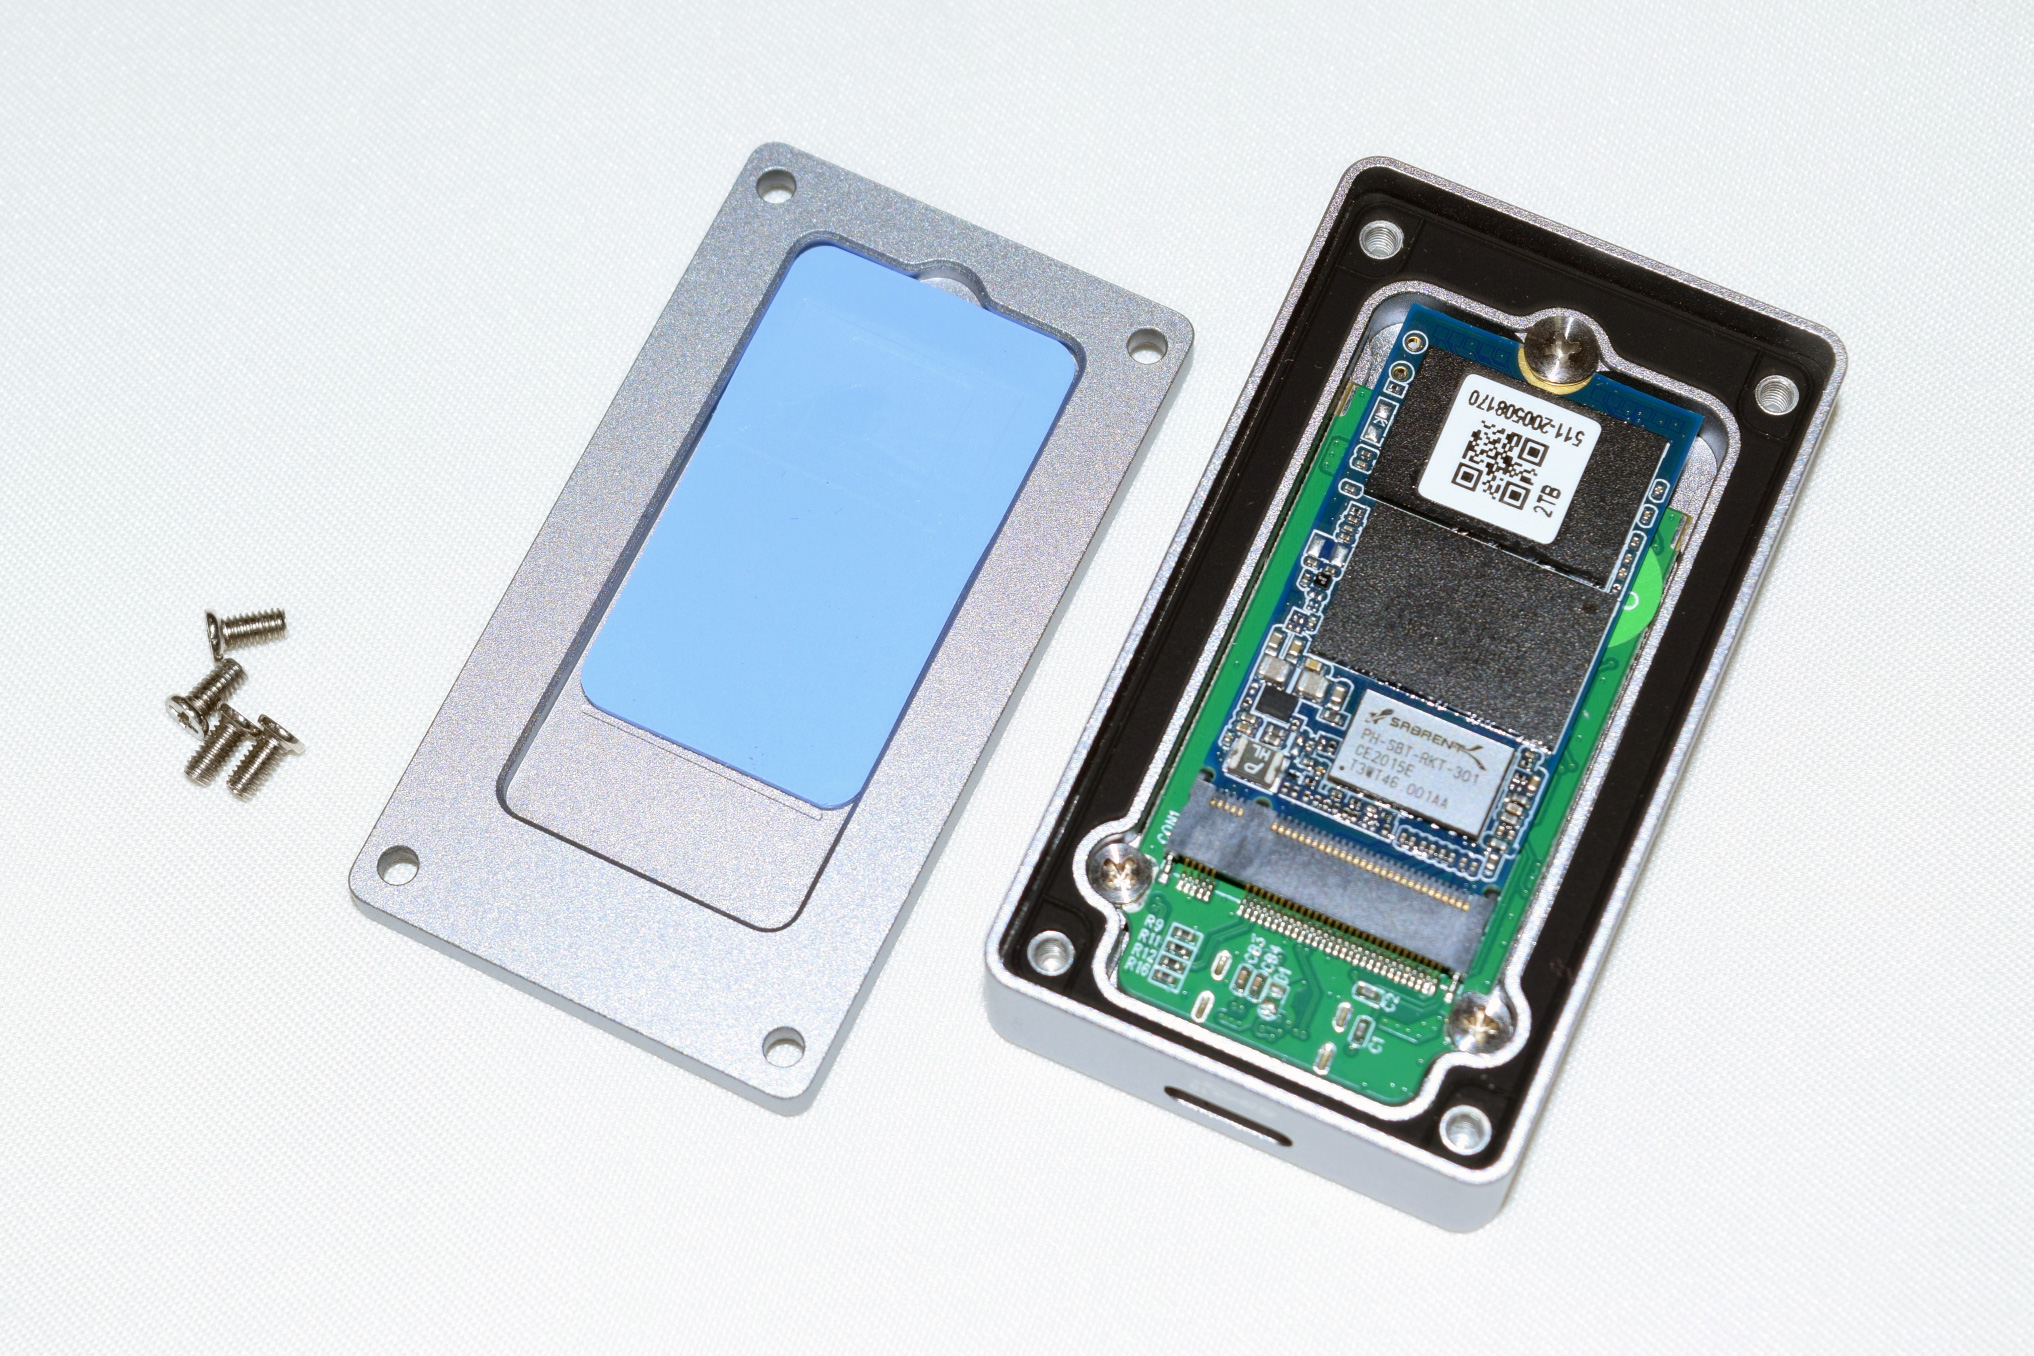
Compared to the 80mm+ length of the other external SSDs in the table above, the M.2 2242 SSD usage enables Sabrent to bring it down to 66mm. The Rocket nano Rugged does make it up with extra thickness, but that actually gives the unit extra help on the thermal side. The Rocket Nano Rugged uses the DRAM-less Rocket nano internal SSD (a Sabrent-branded Phison E13T design). It is connected to the mainboard with a JMicron JMS583 bridge chip. The gallery below presents the teardown pictures of the drive.


The drive is easy to take apart. A thermal pad is affixed to the bottom of the case to help take away heat from the SSD. The Type-C port is also protected by a seal on the inside to prevent water ingress, without having to close up the port completely. The 2TB Rocket Nano SSD is double-sided in order to achieve the desired capacity using the Kioxia 96L BiCS4 3D TLC flash. The DRAM-less nature of the controller helps save precious real estate on the M.2 2242 board. A Phison PS6103 PMIC can also be spotted.
Synthetic Benchmarks - ATTO and CrystalDiskMark
Sabrent claims speeds of up to 1000 MBps, and that is backed up by the ATTO benchmarks provided below. Unfortunately, these access traces are not very common in real-life scenarios.
| Drive Performance Benchmarks - ATTO |
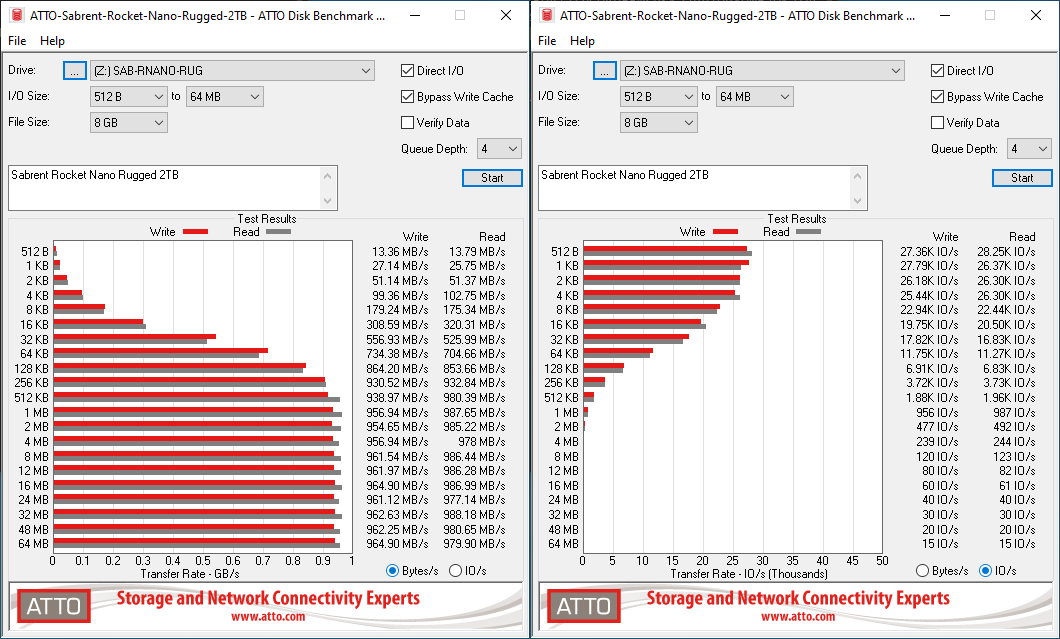 |
With the right type of access trace, the Rocket Nano Rugged can reach up to 962MBps writes and 988MBps reads.
| Drive Performance Benchmarks - CrystalDiskMark |
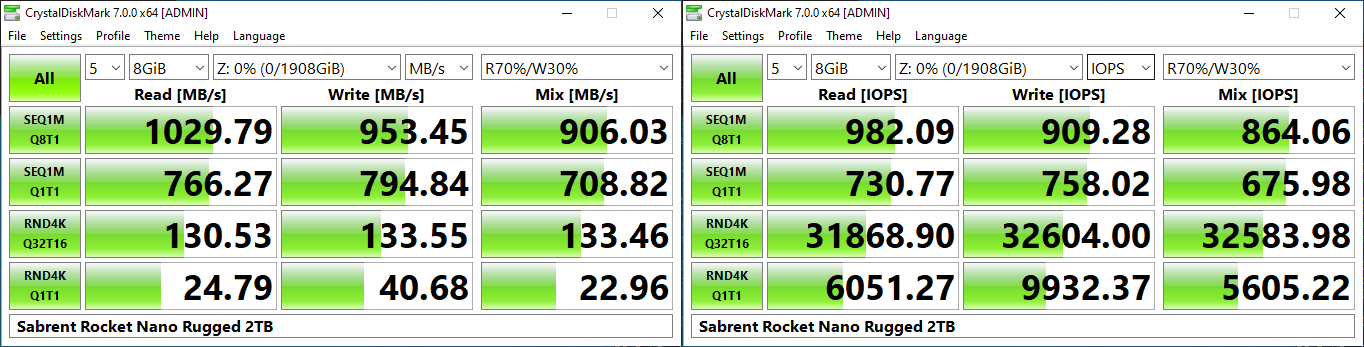 |
CrystalDiskMark, despite being a canned benchmark, provides a better estimate of the performance range with a selected set of numbers. As evident from the screenshot above, the performance can dip to as low as 24.8MBps for low-queue depth random reads.
AnandTech DAS Suite - Benchmarking for Performance Consistency
Our testing methodology for DAS units takes into consideration the usual use-case for such devices. The most common usage scenario is transfer of large amounts of photos and videos to and from the unit. Other usage scenarios include the use of the DAS as a download or install location for games and importing files directly off the DAS into a multimedia editing program such as Adobe Photoshop. Some users may even opt to boot an OS off an external storage device.
The AnandTech DAS Suite tackles the first use-case. The evaluation involves processing three different workloads:
- Photos: 15.6 GB collection of 4320 photos (RAW as well as JPEGs) in 61 sub-folders
- Videos: 16.1 GB collection of 244 videos (MP4 as well as MOVs) in 6 sub-folders
- BR: 10.7 GB Blu-ray folder structure of the IDT Benchmark Blu-ray
Each workload's data set is first placed in a 25GB RAM drive, and a robocopy command is issued to transfer it to the DAS under test (formatted in NTFS). Upon completion of the transfer (write test), the contents from the DAS are read back into the RAM drive (read test). This process is repeated three times for each workload. Read and write speeds, as well as the time taken to complete each pass are recorded. Bandwidth for each data set is computed as the average of all three passes.
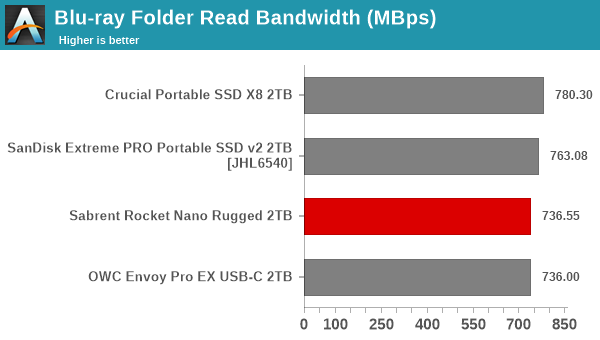
The Rocket Nano Rugged comes in the middle of the pack - the Crucial X8 with QLC flash is optimized for read-intensive workloads, and it easily comes out on top in all the read segments. For writes, the OWC Envoy Pro EX USB-C consistently edges out the Rocket Nano Rugged. That said, it can be seen that the gulf in the numbers between the different units is not very significant. For all practical purposes, the casual user will notice no difference between them in the course of normal usage. However, power users may want to dig deeper to understand the limits of each device. To address this concern, we also instrumented our evaluation scheme for determining performance consistency.
Performance Consistency
Aspects influencing the performance consistency include SLC caching and thermal throttling / firmware caps on access rates to avoid overheating. This is important for power users, as the last thing that they want to see when copying over 100s of GB of data is the transfer rate going down to USB 2.0 speeds.
In addition to tracking the instantaneous read and write speeds of the DAS when processing the AnandTech DAS Suite, the temperature of the drive was also recorded at the beginning and end of the processing. In earlier reviews, we used to track the temperature all through. However, we have observed that SMART read-outs for the temperature in NVMe SSDs using USB 3.2 Gen 2 bridge chips end up negatively affecting the actual transfer rates. To avoid this problem, we have restricted ourselves to recording the temperature at either end of the actual workloads set. The graphs below present the recorded data.
| Performance Consistency and Thermal Characteristics |
 |
The first three sets of writes and reads correspond to the photos suite. A small gap (for the transfer of the video suite from the internal SSD to the RAM drive) is followed by three sets for the video suite. Another small RAM-drive transfer gap is followed by three sets for the Blu-ray folder. An important point to note here is that each of the first three blue and green areas correspond to 15.6 GB of writes and reads respectively. There is no evidence of throttling at play - in fact, the behavior in terms of instantaneous drops in the write rates is similar to that of the Extreme PRO v2 from SanDisk. The OWC Envoy Pro EX USB-C maintains the best performance consistency. On the temperature side, the Rocket Nano Rugged has the steepest rise - a 10C difference between the starting and ending values. When the compact nature of the drive is considered, this doesn't sound too bad. In any case, the ending temperature (absolute value) is not a huge concern.
PCMark 10 Storage Bench - Real-World Access Traces
There are a number of storage benchmarks that can subject a device to artificial access traces by varying the mix of reads and writes, the access block sizes, and the queue depth / number of outstanding data requests. We saw results from two popular ones - ATTO, and CrystalDiskMark - in a previous section. More serious benchmarks, however, actually replicate access traces from real-world workloads to determine the suitability of a particular device for a particular workload. Real-world access traces may be used for simulating the behavior of computing activities that are limited by storage performance. Examples include booting an operating system or loading a particular game from the disk.
PCMark 10's storage bench (introduced in v2.1.2153) includes four storage benchmarks that use relevant real-world traces from popular applications and common tasks to fully test the performance of the latest modern drives:
- The Full System Drive Benchmark uses a wide-ranging set of real-world traces from popular applications and common tasks to fully test the performance of the fastest modern drives. It involves a total of 204 GB of write traffic.
- The Quick System Drive Benchmark is a shorter test with a smaller set of less demanding real-world traces. It subjects the device to 23 GB of writes.
- The Data Drive Benchmark is designed to test drives that are used for storing files rather than applications. These typically include NAS drives, USB sticks, memory cards, and other external storage devices. The device is subjected to 15 GB of writes.
- The Drive Performance Consistency Test is a long-running and extremely demanding test with a heavy, continuous load for expert users. In-depth reporting shows how the performance of the drive varies under different conditions. This writes more than 23 TB of data to the drive.
Despite the data drive benchmark appearing most suitable for testing direct-attached storage, we opted to run the full system drive benchmark as part of our evaluation flow. Many of us use portable flash drives as boot drives and storage for Steam games. These types of use-cases are addressed only in the full system drive benchmark.
The Full System Drive Benchmark comprises of 23 different traces. For the purpose of presenting results, we classify them under five different categories:
- Boot: Replay of storage access trace recorded while booting Windows 10
- Creative: Replay of storage access traces recorded during the start up and usage of Adobe applications such as Acrobat, After Effects, Illustrator, Premiere Pro, Lightroom, and Photoshop.
- Office: Replay of storage access traces recorded during the usage of Microsoft Office applications such as Excel and Powerpoint.
- Gaming: Replay of storage access traces recorded during the start up of games such as Battlefield V, Call of Duty Black Ops 4, and Overwatch.
- File Transfers: Replay of storage access traces (Write-Only, Read-Write, and Read-Only) recorded during the transfer of data such as ISOs and photographs.
PCMark 10 also generates an overall score, bandwidth, and average latency number for quick comparison of different drives. The sub-sections in the rest of the page refrence the access traces specified in the PCMark 10 Technical Guide.
Booting Windows 10
The read-write bandwidth recorded for each drive in the boo access trace is presented below.
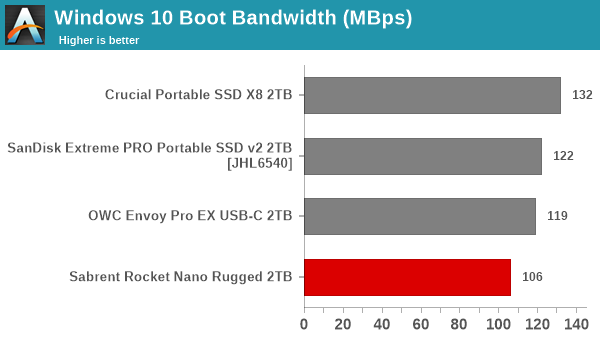
The DRAM-less nature of the drive may be a factor in the Rocket Nano Rugged's slow boot response compared to the other SSDs in the list.
Creative Workloads
The read-write bandwidth recorded for each drive in the sacr, saft, sill, spre, slig, sps, aft, exc, ill, ind, psh, and psl access traces are presented below.
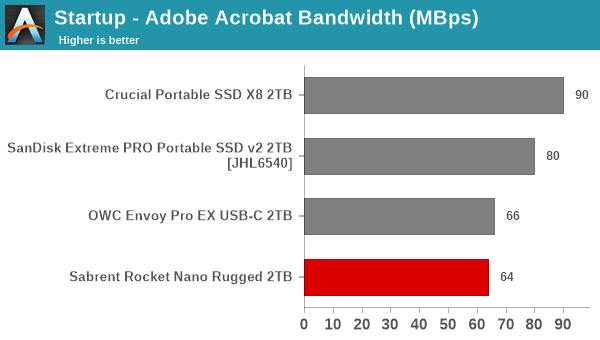
The behavior of the Rocket Nano Rugged is similar to the Envoy Pro EX USB-C in most of the workloads, indicative of the general behavior of Phison's controller. However, the DRAM-less nature pulls down the Rocket Nano Rugged slightly lower.
Office Workloads
The read-write bandwidth recorded for each drive in the exc and pow access traces are presented below.
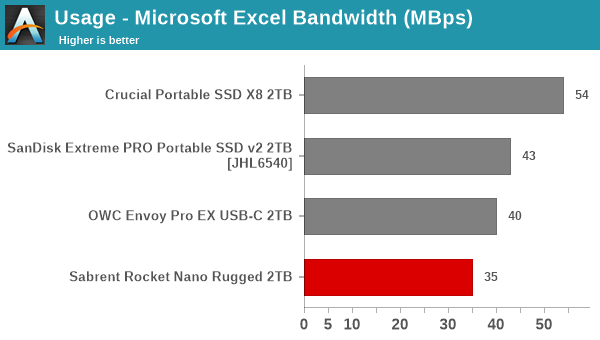
The behavior is similar for office workloads, with the lack of on-board DRAM a likely contributing factor to the Rocket Nano Rugged's bottom-of-the-pack performance.
Gaming Workloads
The read-write bandwidth recorded for each drive in the bf, cod, and ow access traces are presented below.
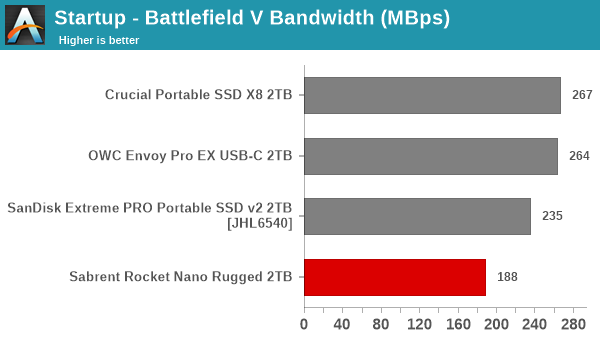
As the only DRAM-less drive in the list, the gaming workloads also do not bring any joy to the Rocket Nano Rugged.
Files Transfer Workloads
The read-write bandwidth recorded for each drive in the cp1, cp2, cp3, cps1, cps2, and cps3 access traces are presented below.
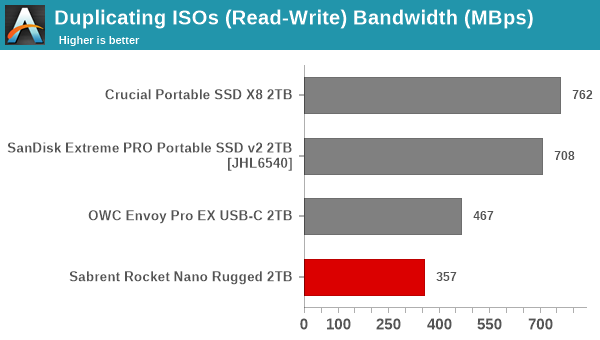
The Rocket Nano Rugged delivers decent performance, but the competition is just way too far ahead, thanks to their use of a M.2 2280 SSD with DRAM on-board.
Overall Scores
PCMark 10 reports an overall score based on the observed bandwidth and access times for the full workload set. The score, bandwidth, and average access latency for each of the drives are presented below.
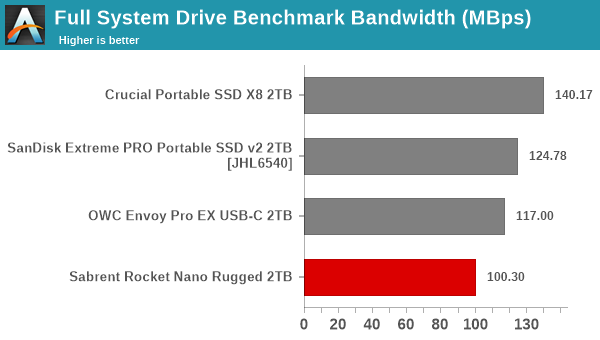
The overall scores are a reflection of the performance of the Rocket Nano Rugged in the previous sub-sections.
Miscellaneous Aspects and Concluding Remarks
The performance of the drives in various real-world access traces as well as synthetic workloads was brought out in the preceding sections. We also looked at the performance consistency for these cases. Power users may also be interested in performance consistency under worst-case conditions, as well as drive power consumption. The latter is also important when used with battery powered devices such as notebooks and smartphones. Pricing is also an important aspect. We analyze each of these in detail below.
Worst-Case Performance Consistency
Flash-based storage devices tend to slow down in unpredictable ways when subject to a large number of small-sized random writes. Many benchmarks use that scheme to pre-condition devices prior to the actual testing in order to get a worst-case representative number. Fortunately, such workloads are uncommon for direct-attached storage devices, where workloads are largely sequential in nature. Use of SLC caching as well as firmware caps to prevent overheating may cause drop in write speeds when a flash-based DAS device is subject to sustained sequential writes.
Our Sequential Writes Performance Consistency Test configures the device as a raw physical disk (after deleting configured volumes). A fio workload is set up to write sequential data to the raw drive with a block size of 128K and iodepth of 32 to cover 90% of the drive capacity. The internal temperature is recorded at either end of the workload, while the instantaneous write data rate and cumulative total write data amount are recorded at 1-second intervals.
| Sequential Write to 90% of Disk Capacity - Performance Consistency |
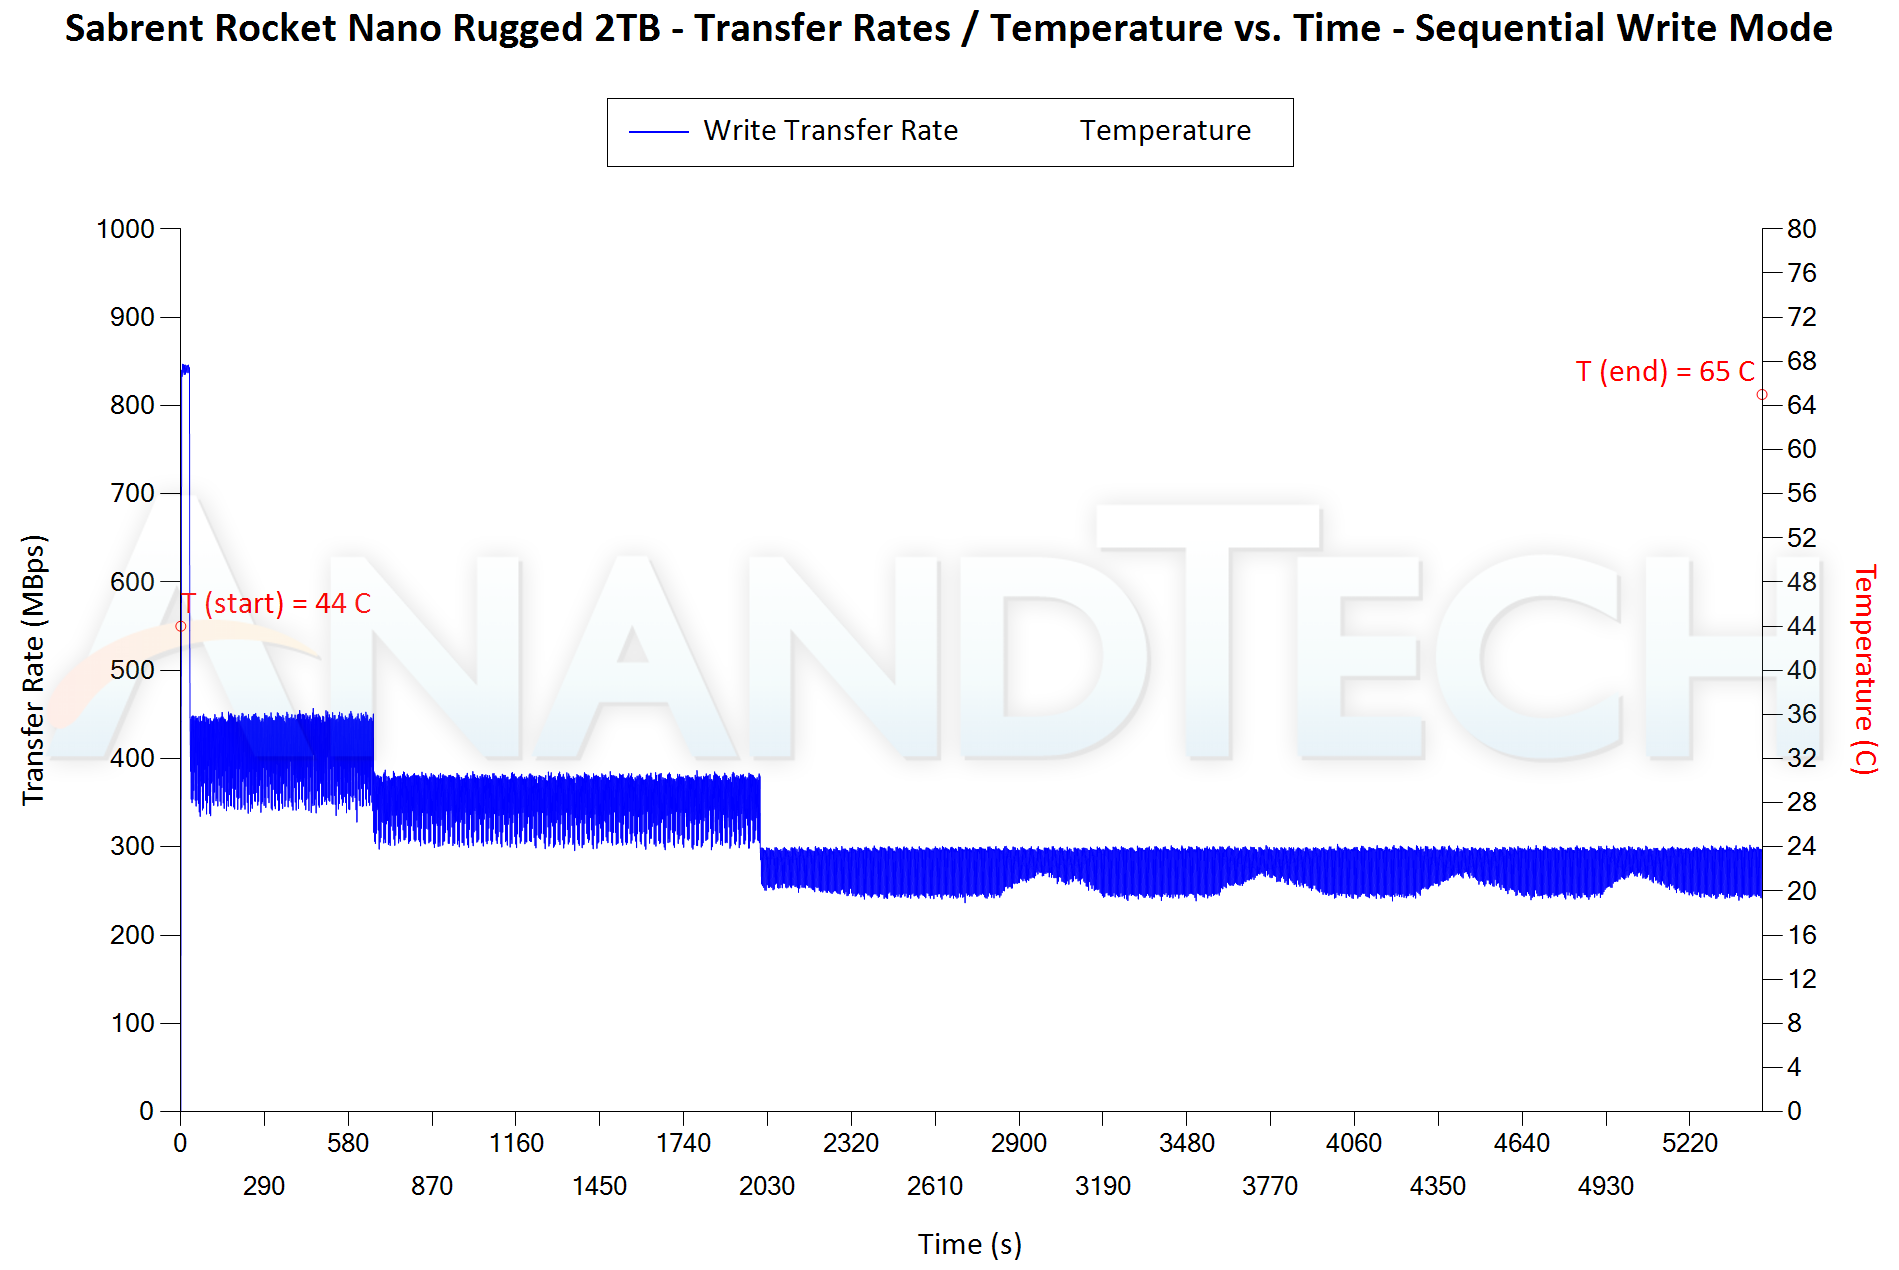 |
The Sabrent Rocket Nano Rugged 2TB has around 25GB of SLC cache, which gets exhausted in around 30s at maximum transfer rates. Beyond that, the drive has three performance levels averaging around 400 MBps, 350 MBps, and 280 MBps. The Crucial X8 with a similar drive capacity has 10x the SLC cache (around 256GB), but its direct-to-QLC write is around 150 MBps. The Rocket Nano Rugged is better consistency-wise, though we would have appreciated a larger amount of SLC cache in the drive. Unfortunately for the Rocket Nano Rugged, the OWC and SanDisk drives on the same interface can sustain direct-to-TLC write rates matching that of the maximum practical input write rate (i.e, signs of SLC caching are not evident in the sequential write performance consistency test). The temperature at the end of the stress test (65C) was similar to the ones obtained for the Crucial X8 and the SanDisk Extreme PRO v2. The OWC Envoy PRO EX USB-C has the best thermal design of the lot.
Power Consumption
Bus-powered devices can configure themselves to operate within the power delivery constraints of the host port. While Thunderbolt 3 ports are guaranteed to supply up to 15W for client devices, USB 2.0 ports are guaranteed to deliver only 4.5W (900mA @ 5V). In this context, it is interesting to have a fine-grained look at the power consumption profile of the various drives. Using the Plugable USBC-TKEY, the bus power consumption of the drives was tracked while processing the CrystalDiskMark workloads (separated by 30s intervals). The graphs below plot the instantaneous bus power consumption against time, while singling out the maximum and minimum power consumption numbers.
| Drive Power Consumption - CrystalDiskMark Workloads |
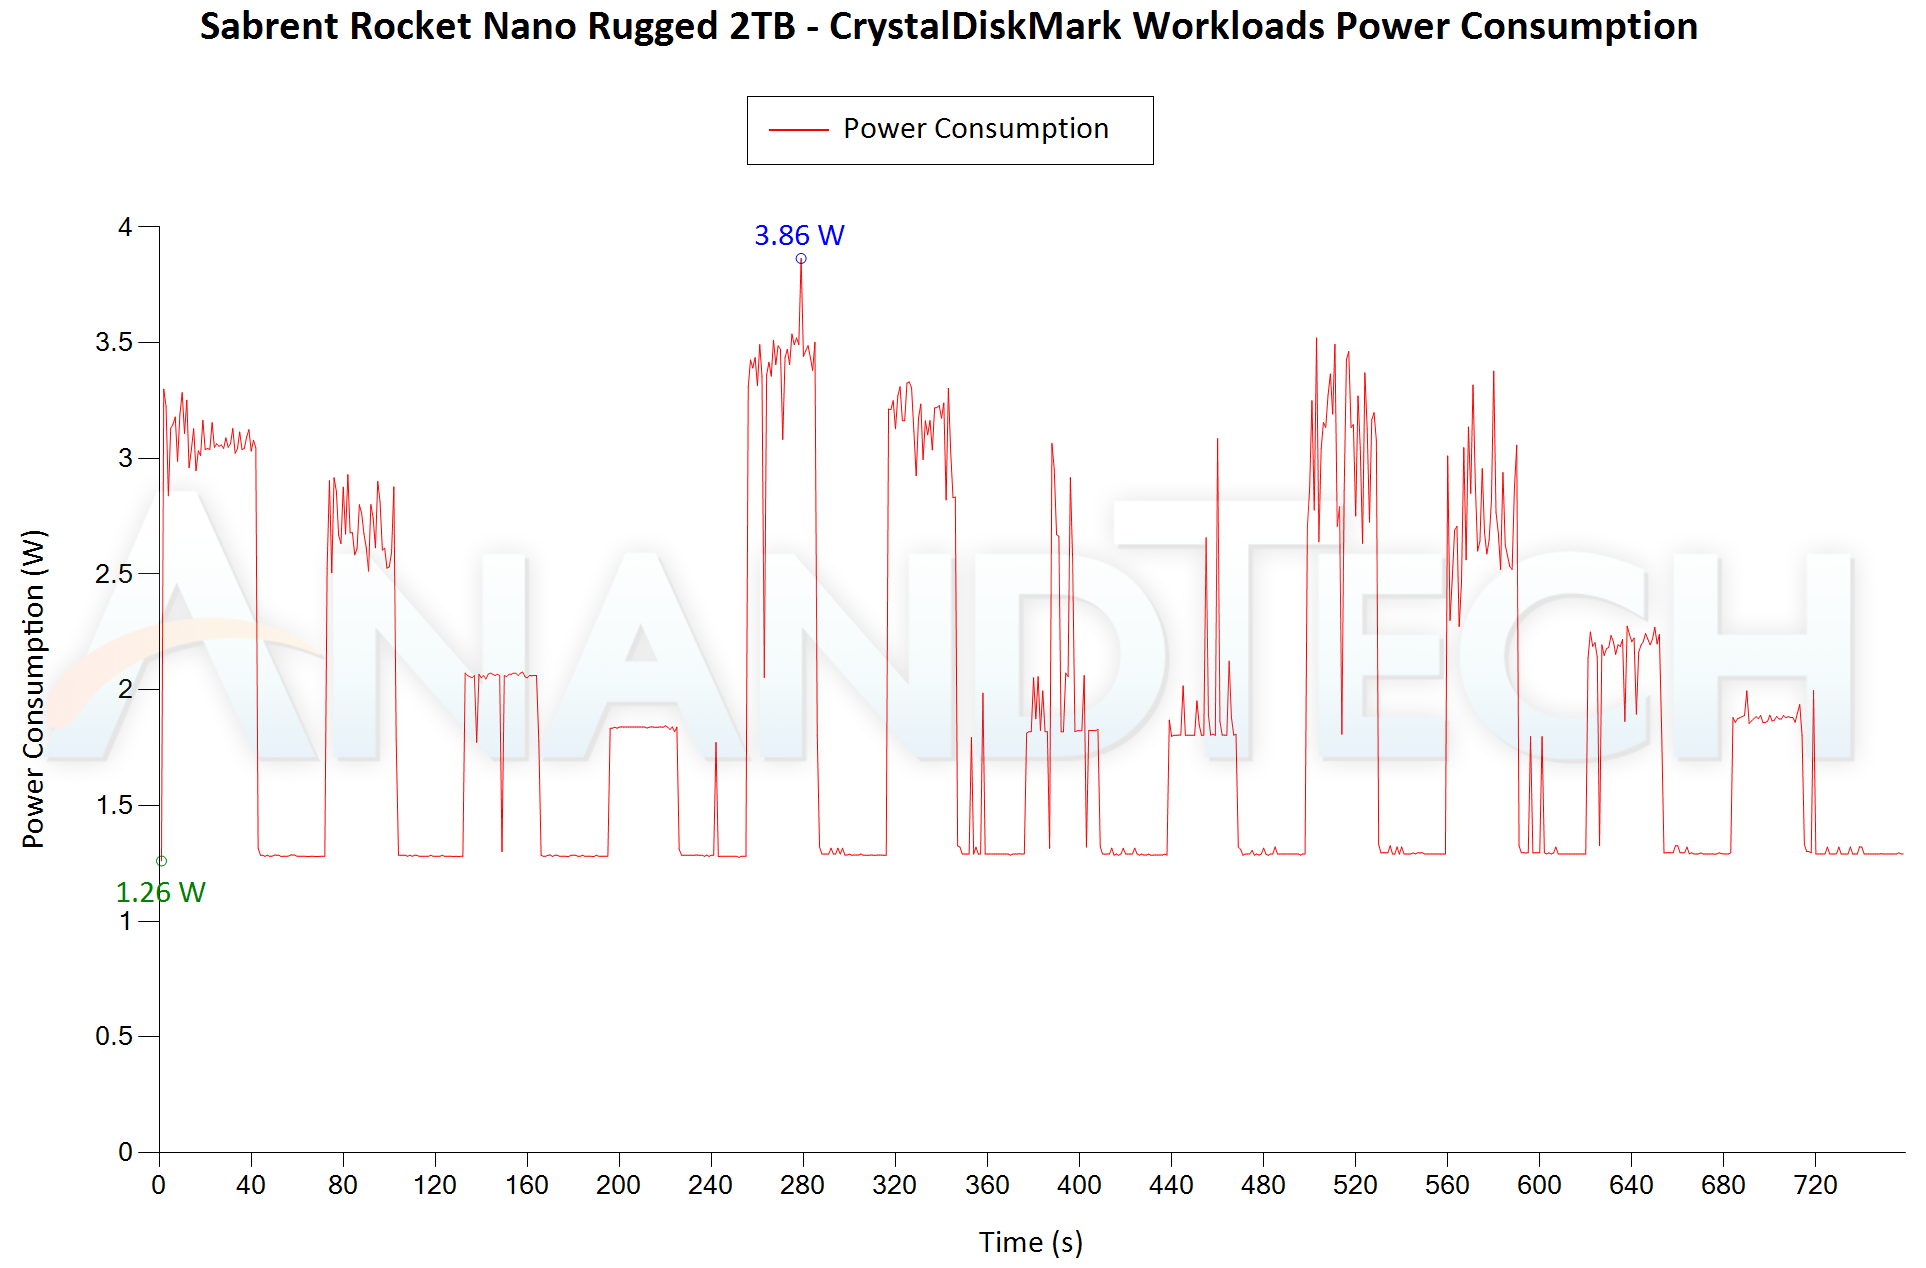 |
The DRAM-less nature is an advantage for the Rocket Nano Rugged here, with the drive recording the lowest peak power consumption of all four considered drives. The idle power at 1.26 is reasonable, though not as low as the 0.86W of the OWC Envoy Pro EX USB-C drive.
Pricing
The price of flash-based storage devices tend to fluctuate quite a bit over time. However, the relative difference between different models usually doesn't change. The table below summarizes the product links and pricing for the various units discussed in the review.
| External Flash Storage Devices - Pricing | ||||
| Product | Model Number | Capacity (GB) | Street Price (USD) | Price per GB (USD/GB) |
| Crucial Portable SSD X8 2TB | CT2000X8SSD9 | 2000 | $307 | 0.1535 |
| Sabrent Rocket Nano Rugged 2TB | SB-2TB-NAWP | 2048 | $330 | 0.1611 |
| SanDisk Extreme PRO Portable SSD v2 2TB | SDSSDE81-2T00 | 2000 | $400 | 0.2 |
| OWC Envoy Pro EX USB-C 2TB | ENVPROC2N20 | 1920 | $399 | 0.2078 |
The Sabrent Rocket Nano has a very reasonable price in terms of the cost per GB - at approximately 16 cents per GB, it is the most economical of the TLC drives in the mix.
Final Words
After careful analysis of various aspects (including benchmark numbers, temperatures, power consumption, and pricing), it is clear that the appeal of the Sabrent Rocket Nano Rugged is not in the performance numbers, but the unique nature - To the best of our knowledge, there is no other 2TB external SSD equipped with 3D TLC flash with a footprint as small as that of the Rocket Nano Rugged. The industrial design is also attractive, though that is a subjective metric. Sabrent has opted for some tradeoffs to achieve the cost and compact sizing - a DRAM-less internal SSD had to be used, and that pulls down the performance numbers compared to other 2TB drives in the market. For normal consumer workloads and casual usage, this drawback might not be a factor to consider at all. The IP67 rating and rugged nature further enhance the appeal of the drive - the OWC Envoy Pro EX USB-C also has a IP67 rating, but it is priced significantly higher.
The thermal profile of the Sabrent Rocket Nano is good enough to prevent it from getting too hot to touch. In any case, the rubber bumper ensures that the hot metal casing is never a problem for handling. Overall, the Sabrent Rocket Nano stands out in the crowded market thanks to its unique feature set and cost-performance balance. At $330 for the 2TB version, it presents a compelling option for the casual user looking to source a compact high-capacity external SSD.


10 Comments
View All Comments
R3MF - Friday, October 30, 2020 - link
If i wanted a 2TB 10gbps nvme drive to back up a single 1.8TB file - then I guess i want max transfer speeds that can be sustained across the full capacity of the disk:Which benchmark am I look at above?
What does this requirement suggest for the most appropriate drive?
ballsystemlord - Friday, October 30, 2020 - link
The benchmark you want is: "Worst-Case Performance Consistency".The requirements you set forth recommend: "SanDisk Extreme PRO Portable SSD v2 2TB" or "OWC Envoy Pro EX USB-C 2TB".
I'd look over some more drives being benchmarked at AT before settling on those 2. That way you can add more choices and get the best endurance of the set.
R3MF - Saturday, October 31, 2020 - link
smashing, thank you.ballsystemlord - Friday, October 30, 2020 - link
Actually, you might need a larger drive than the 2TB here because your file is probably being measured in TB whereas the manufacturers measure drives in TiB. That's base 1024 vs. base 1000.dwillmore - Friday, October 30, 2020 - link
You have that backwards. TiB is larger than TB.ballsystemlord - Saturday, October 31, 2020 - link
My mistake. Thanks for correcting it.ballsystemlord - Friday, October 30, 2020 - link
Here's a 4TB one: https://www.amazon.com/dp/B088K6XT7K/ref=twister_B...Slash3 - Friday, October 30, 2020 - link
"The read-write bandwidth recorded for each drive in the boo access trace is presented below."Spooky.
imaheadcase - Friday, October 30, 2020 - link
Whats up with the portable SSD reviews/news of late? Very weird trend to see here. Even the "news" section is just deals being posted..not exactly big deals anyway just affiliate link crap.dwillmore - Friday, October 30, 2020 - link
Non-uniformly scaled graphs make for poor visual comparisons.